- Industrility
- Apps
- Sensors
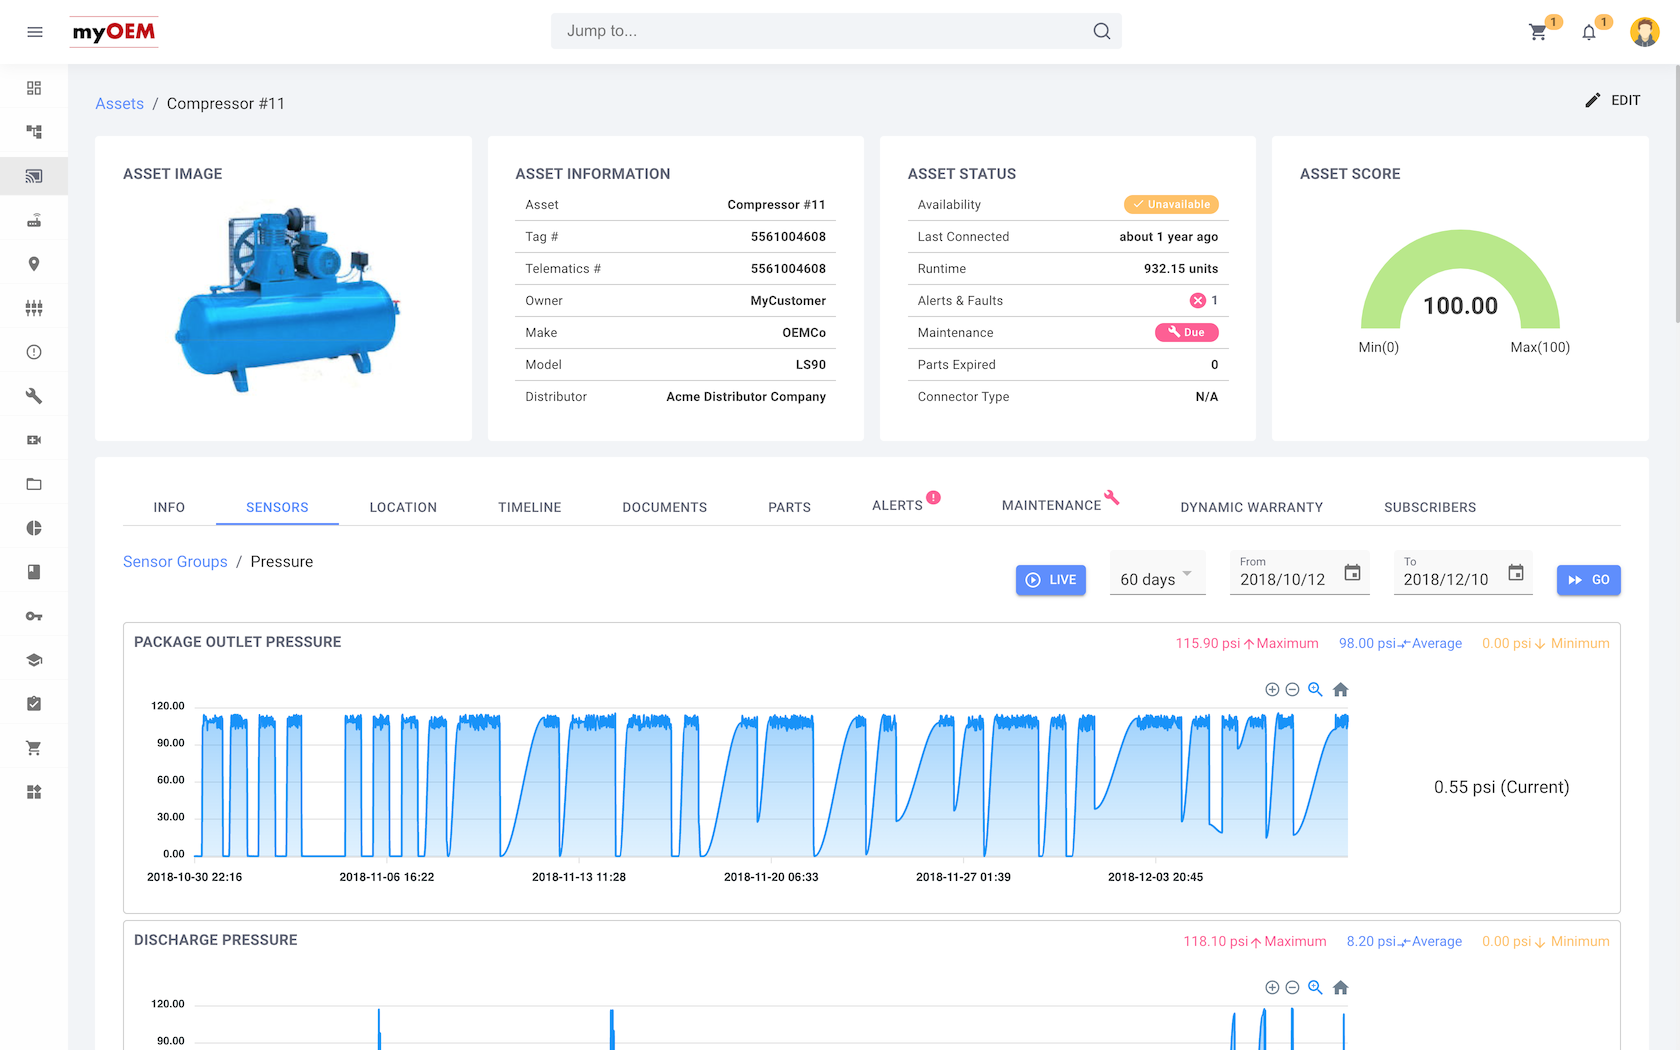
Visualize live and historical time-series data for each sensor of an asset
Remote Monitoring is table stakes. Remote Troubleshooting is not. Beyond remote monitoring, how can you fix customer’s problems?


Monitor your machines in real-time
With our solution, you can quickly detect and respond to issues as they arise, optimize machine performance, and reduce downtime.
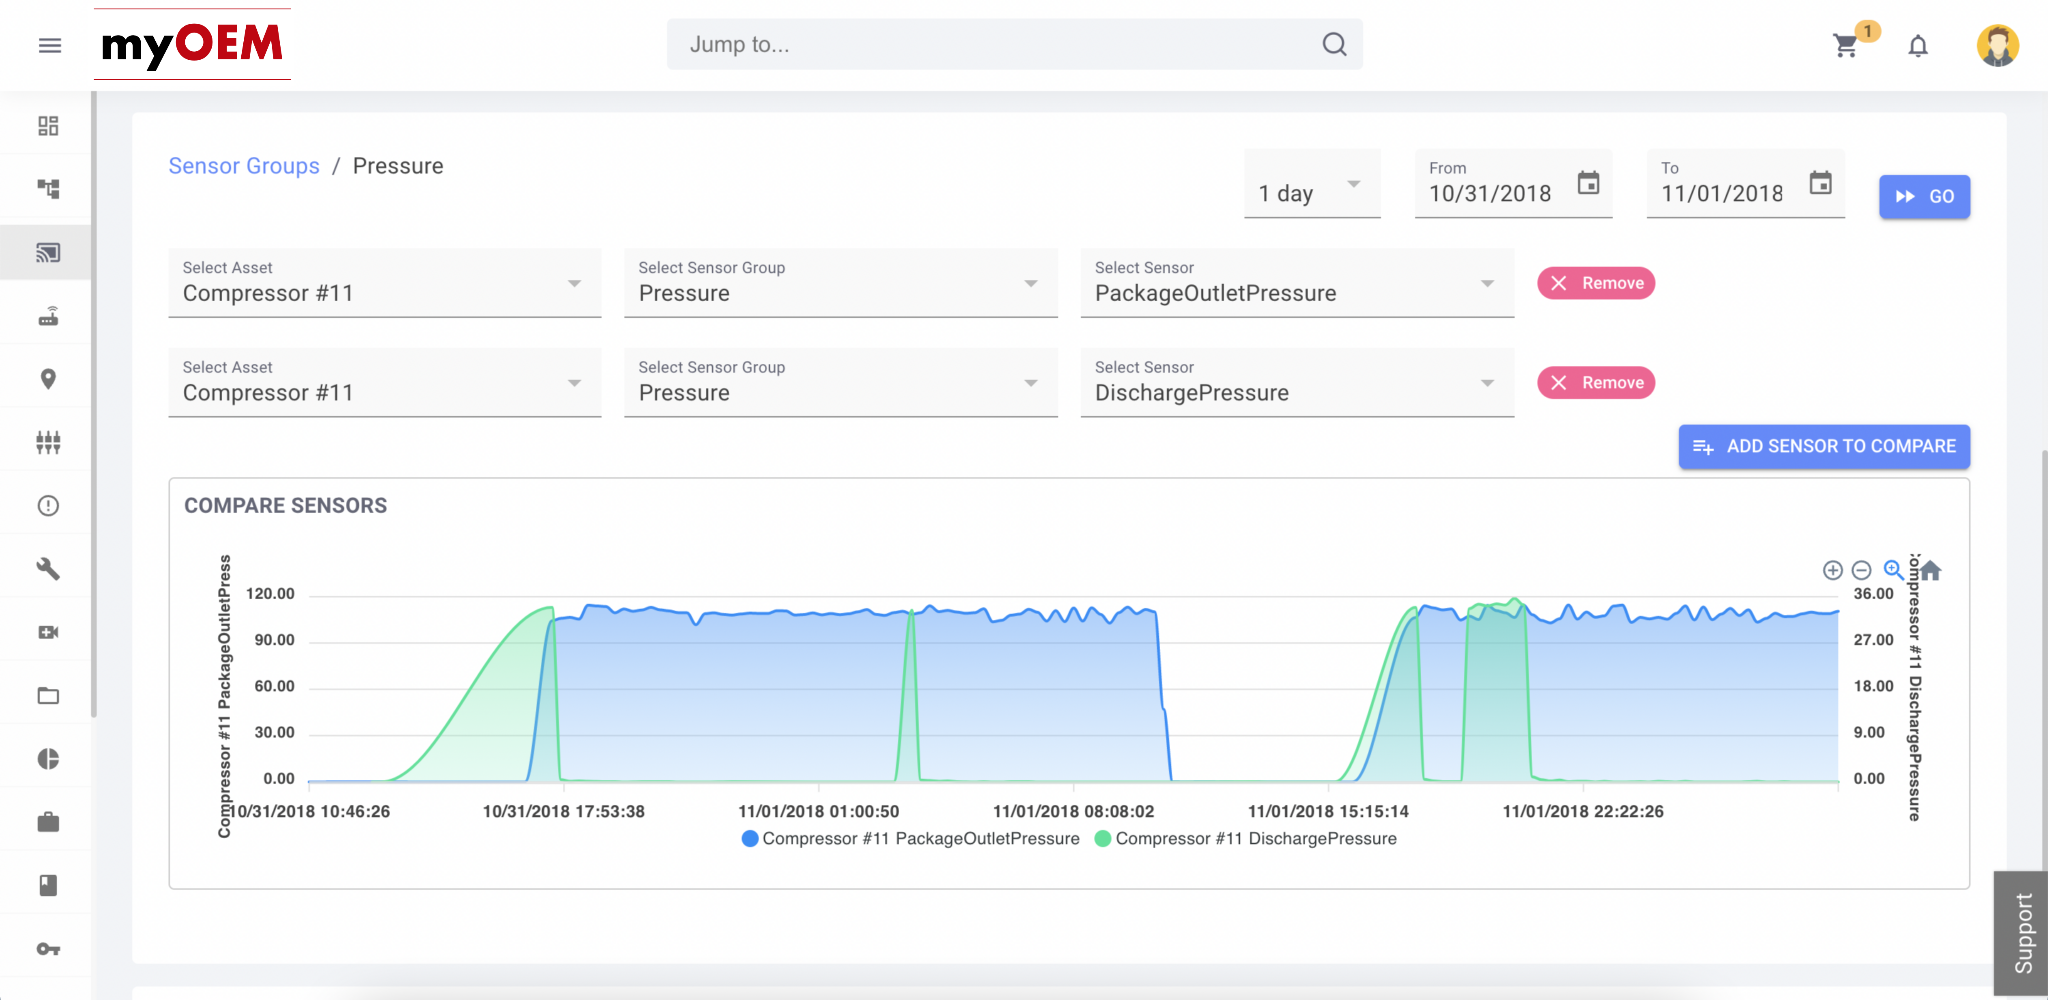
Compare and analyze your sensor values with ease using our solution.
Our sensor values comparison solution provides an easy and intuitive way to compare and analyze your sensor data. This will help you understand patterns, anomalies, and correlations.


Features
- Realtime sensor graph
- Historical sensor values
- Sensor grouping
- Sensor graph comparison
Real-time sensors values
Remote monitoring of each sensor’s current value and its time-series, average, min and max
Historical Time Series
Capture patterns, visualize trends of Asset’s sensor values by going back in time
Group Sensors Easily
Easily group sensors into SensorGroups and PartGroups for easy navigation
