How to Grow Aftermarket Revenue: A 4-Step Framework for OEMs
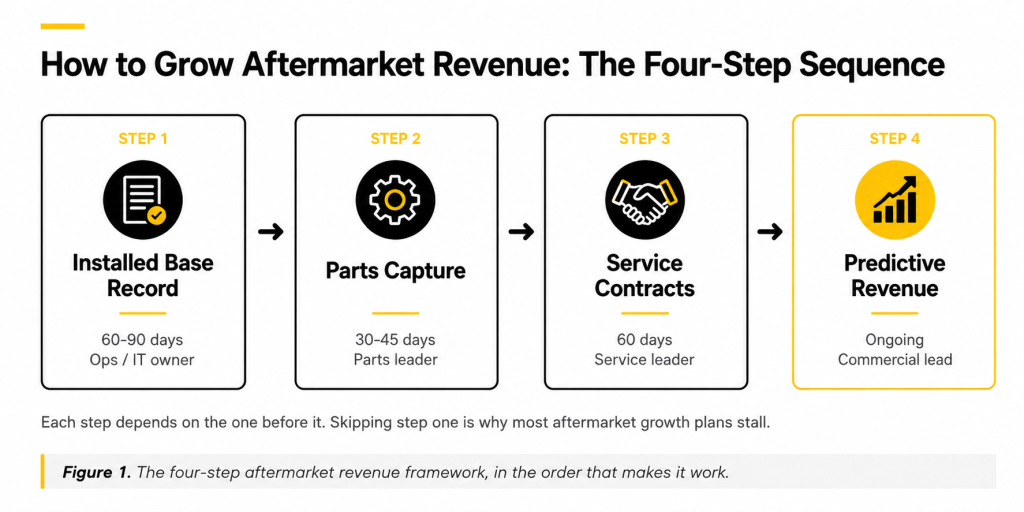
To grow aftermarket revenue, an OEM needs four things in sequence: one accurate installed base record, a fixed parts capture process, service packaged into contracts, and a way to spot opportunities before the customer calls. Most aftermarket revenue growth strategies stall because they skip step one and try to sell service on top of bad data.
Why Most Aftermarket Revenue Growth Strategies Stall
Equipment margins have compressed for years, and aftermarket services are the obvious offset. McKinsey’s research across 30 industries found average EBIT margin for aftermarket services runs around 25 percent, against roughly 10 percent for new equipment. A separate analysis with the Association of Equipment Manufacturers found OEMs with a service arm run at roughly twice the EBIT of peers without one.
The opportunity is well documented. The execution gap is not. Most manufacturers can describe it in a board deck and still cannot answer one question: of the machines we sold in the last fifteen years, how many are still in service, and who runs them today?
There is a second, quieter reason. Aftermarket growth gets assigned to whichever department asked for it, and none of those plans share a data source. Sequencing is what turns disconnected departmental targets into one revenue motion.
The Aftermarket Revenue Framework: Four Steps to Recurring Revenue
Step 1: Build One Accurate Installed Base Record
Owner: one named person in operations or IT, not a committee.
Realistic time estimate: 60 to 90 days for a mid-size fleet.
Most common mistake: treating it as a data project with no accountable owner, so it stalls.
Every machine you have sold needs one record: serial number, configuration, install location, current owner, warranty status and service history. Most manufacturers have this scattered across an ERP, a CRM, a dealer system and spreadsheets nobody has reconciled in years. Two-thirds of an installed base commonly has no confirmed current location once a manufacturer goes looking, because machines change hands and dealers keep their own records.
This step produces no revenue by itself, which is exactly why it gets skipped. Parts quoting, contract pricing and predictive alerts all read from this record, so its quality sets the ceiling on all three.
The economics are the reason this category exists. Both catalog-first and asset-first platforms are competing for a share of the most profitable revenue an OEM has.
Step 2: Fix Parts Capture Before Adding New Revenue Lines
Owner: the aftermarket or parts leader.
Realistic time estimate: 30 to 45 days to audit catalog-to-serial-number matching.
Most common mistake: re-pricing parts before fixing the matching problem.
Parts revenue rarely leaks because pricing is wrong. It leaks because a technician cannot confirm which of several similar parts fits the machine in front of them, so the quote takes days instead of minutes and the customer buys a copy part before yours arrives. Every hour of delay is an hour a competitor can win that order.
Fixing it means linking the catalog to the actual asset by serial number, not by model family. A catalog that assumes every unit of a model is identical will misquote every field-modified unit, and most fleets carry more modifications than anyone remembers. Re-pricing before fixing the match improves margin only on the orders you were already winning.
Step 3: Turn Service Into a Contract Business
Owner: the service or warranty leader.
Realistic time estimate: 60 days to design and price two or three tiers against cost-to-serve data.
Most common mistake: flat-rate contracts with no margin tracking, which becomes a liability nobody notices until renewal.
Reactive, time-and-materials service caps revenue at whatever breaks this quarter and makes the aftermarket line impossible to forecast. Contracted coverage converts service into a recurring line finance can plan around, and changes the customer conversation from a repair invoice to a renewal. It only works if cost to serve is known per machine class, which depends on step one. A contract priced without that data is a guess with a signature on it.
Step 4: Find Aftermarket Revenue Before the Customer Calls
Owner: the aftermarket or commercial leader, supported by IT.
Realistic time estimate: ongoing, with first useful alerts typically within 90 days of clean data.
Most common mistake: buying condition-monitoring hardware before the data is trustworthy, so nobody trusts the alerts.
With the first three steps in place, an OEM can identify service, parts and upgrade opportunities from operating data and maintenance history rather than waiting for a failure call. This is where recurring revenue compounds: renewals with usage evidence attached, parts orders triggered by real wear patterns, and upgrade conversations that start with a specific machine. It is also where the commercial argument changes, because you are bringing the customer information they do not have.
Aftermarket Revenue Per Machine: What One Unit Is Worth
The reason this sequence is worth the effort shows up in the math on one unit. Take a machine selling for roughly $100,000. The sale itself returns around $15,000 in profit at a 15 percent margin. Annual aftersales revenue of roughly $5,000 adds up to about $150,000 over a 30-year service life, and at a margin north of 50 percent that returns roughly $75,000 in profit: about five times the profit of the original sale.
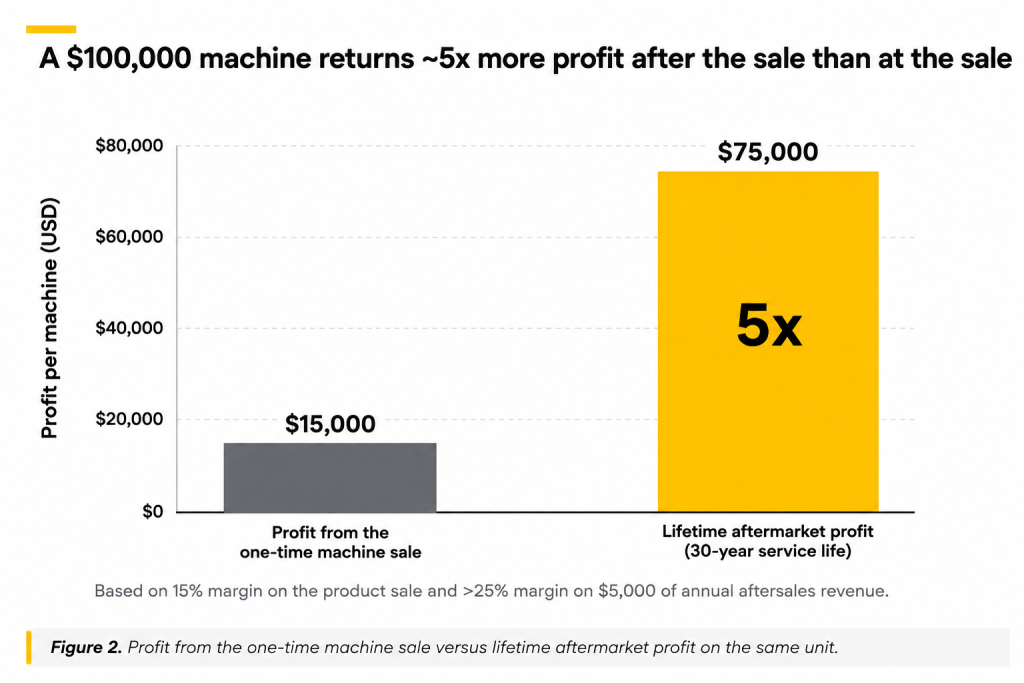
That gap is the argument for treating aftermarket as a managed revenue line rather than a byproduct of equipment sales. None of that $75,000 is reachable if nobody can say with confidence that the machine is still running, where it is, or who owns it.
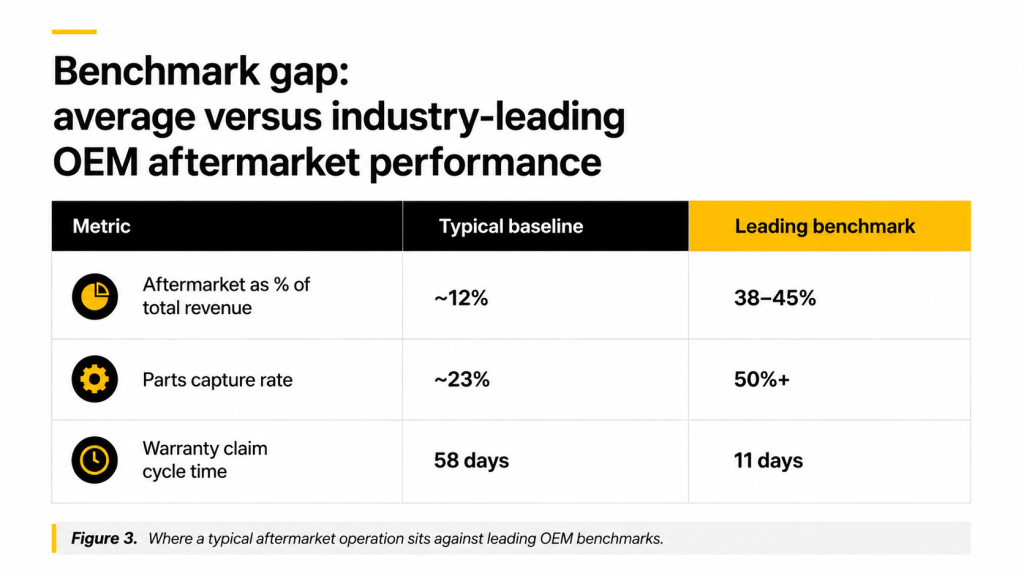
In one Industrility engagement with a manufacturer running roughly 44,800 machines, aftermarket revenue grew from 12 percent of total revenue to 32 percent over five years after the company built a complete digital record of its installed base and rebuilt parts and service processes around it. Parts capture moved from 23 percent toward 50 percent. Warranty claim cycle time dropped from 58 days to 11. None of those gains started with a new sales offer.
Aftermarket Revenue KPIs Every OEM Executive Should Track
A single aftermarket revenue target cannot be managed, because when it misses nobody can say which part of the business caused it. These four metrics can be. Each measures a different step, so a flat number points to a specific fix rather than a general instruction to sell more.
Read it left to right: the metric, what a healthy number looks like, and what to do when it is not moving.
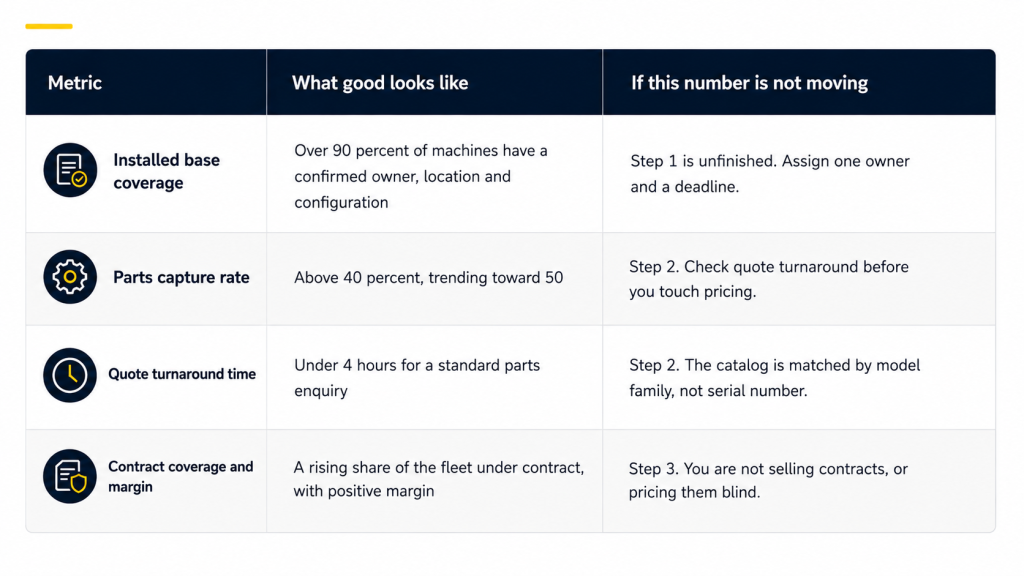
Aftermarket revenue as a percentage of total revenue is the number the board asks about, but it is a result, not a lever. It moves only when the four metrics above move.
Review these monthly with one owner named against each. Quarterly is too slow to catch a parts capture problem before it becomes an annual miss.
Common Mistakes That Stall Aftermarket Revenue Growth
- Sequencing contracts before parts capture. Contracts get the attention because they look like recurring revenue on a slide, but a service organisation that cannot quote a part in under an hour will not retain a contract customer for long.
- Setting a target with no baseline. Grow aftermarket 20 percent is not falsifiable if nobody agrees what current aftermarket revenue is.
- Assigning aftermarket growth to sales alone. Step one belongs to whoever owns product and service data. If sales is asked to hit an aftermarket number without that foundation, the plan becomes a set of individual account pushes rather than a system.
- Waiting for perfect data. An installed base record does not need to be complete to be useful. Start step two on the machine family with the cleanest data while the rest of the fleet is still being reconciled.
- Buying software before naming an owner. A platform accelerates a sequence somebody is already accountable for. It does not create the accountability.
Where This Fits Into an Aftermarket Service Lifecycle Platform
The first two steps can be run with spreadsheets. Steps three and four are harder to sustain that way, which is where manufacturers introduce a platform built around installed base intelligence rather than a single function. A parts commerce and catalog system linked to the same serial-number record used for field service and contract management removes reconciliation work. Remote monitoring tied to that record is what makes step four possible at scale, rather than a handful of manually reviewed alerts.
Frequently Asked Questions
What is the fastest way to grow aftermarket revenue?
There is no fast path that skips the installed base record. Fix data on your highest-volume machine family, get parts quoting accurate for it, then expand.
How long does it take to see aftermarket revenue growth?
Data cleanup typically takes 60 to 90 days, and parts capture improvements can follow within a quarter. Contract and predictive revenue take two to three quarters to compound, since they depend on a full service cycle of clean data.
How do we improve parts capture rate?
Cut quote turnaround time, which usually means linking the parts catalog to the installed base by serial number rather than model family.
What is a good aftermarket revenue target as a percentage of total revenue?
Industry-leading OEMs commonly run 38 to 45 percent against an industry average closer to 12 percent. The right target depends on equipment type, service life and current baseline, which is why the baseline comes first.